PROJECT SUMMARY

Goal: Create flexible Search Filter sections for a new web app that helps Production Engineers investigate and debug infrastructure Service Router issues faster, consequently reducing operational load.

Company: Social Networking, Infrastructure

Deliverables: Discovery, Requirements Gathering, Features Definition, Technical Research, User Interface Design, Interaction Design, Interactive Prototypes, Software Development

PROJECT DETAILS

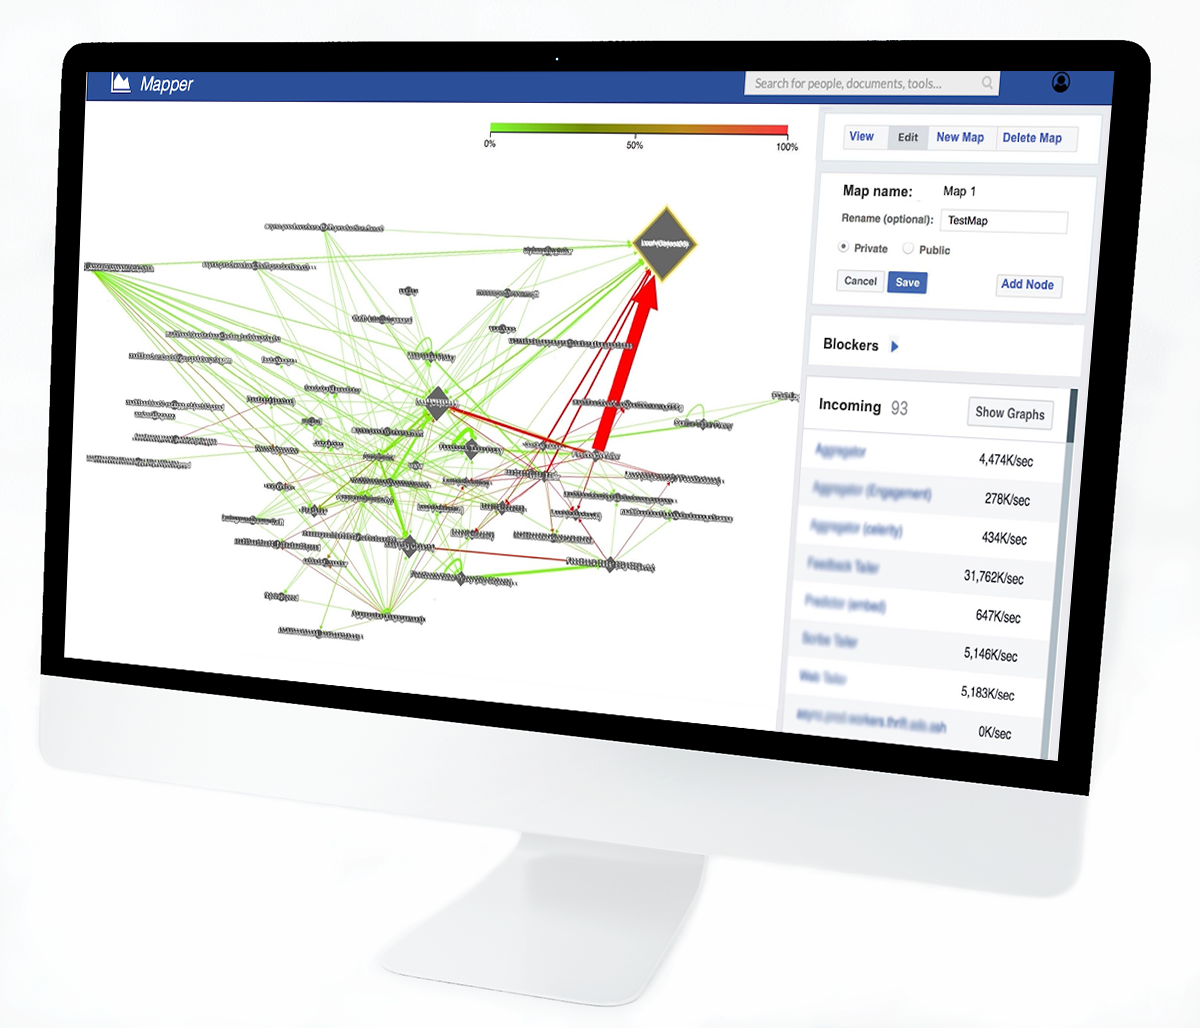
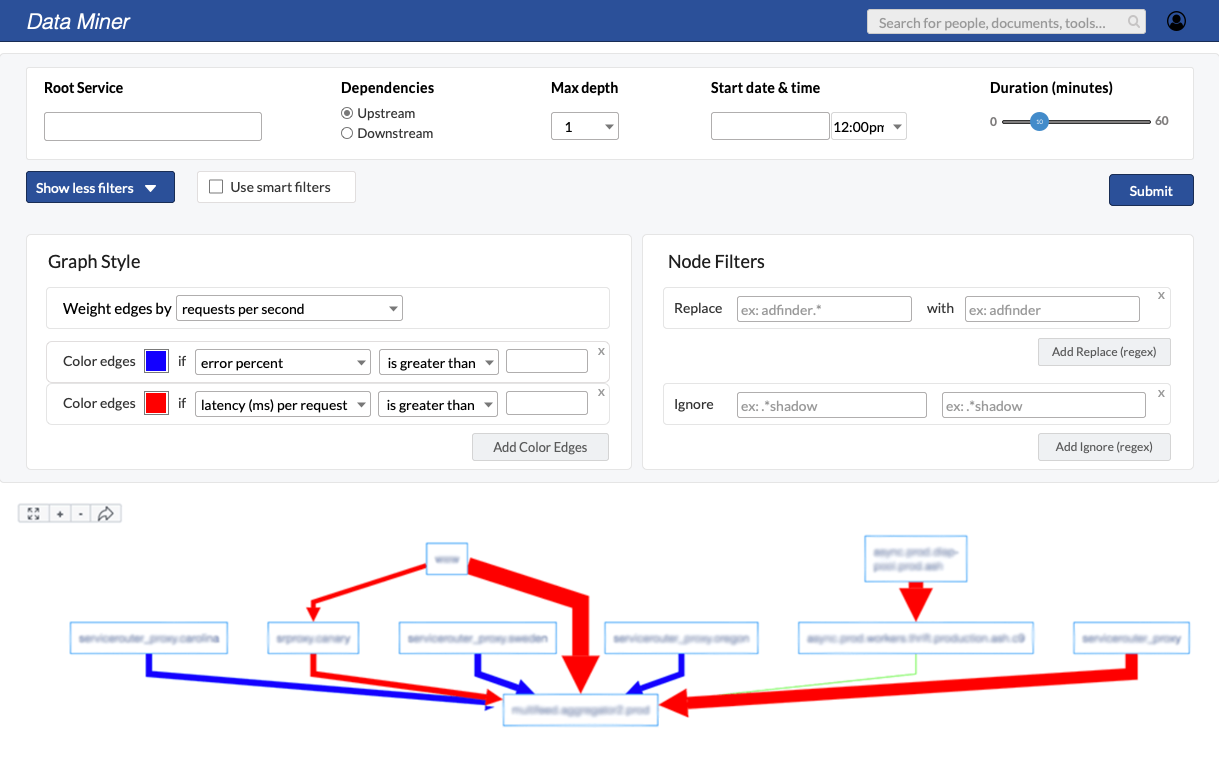
This new web app is a powerful debugging tool that uses live data to generate a map of Service Router dependencies related to specific infrastructure Service Router production issues.

The app enables Production Engineers to specify search parameters in the form of a query and produce data aggregation graphs and insights that are targeted and meaningful.

Reducing the amount of time and effort spent on retrieving information from Big Data sources results in resolving production issues faster and reducing operational load.

  • Sole designer in a team of two Data Engineers and a Technical Program Manager
  • Ownership of the User Interface design
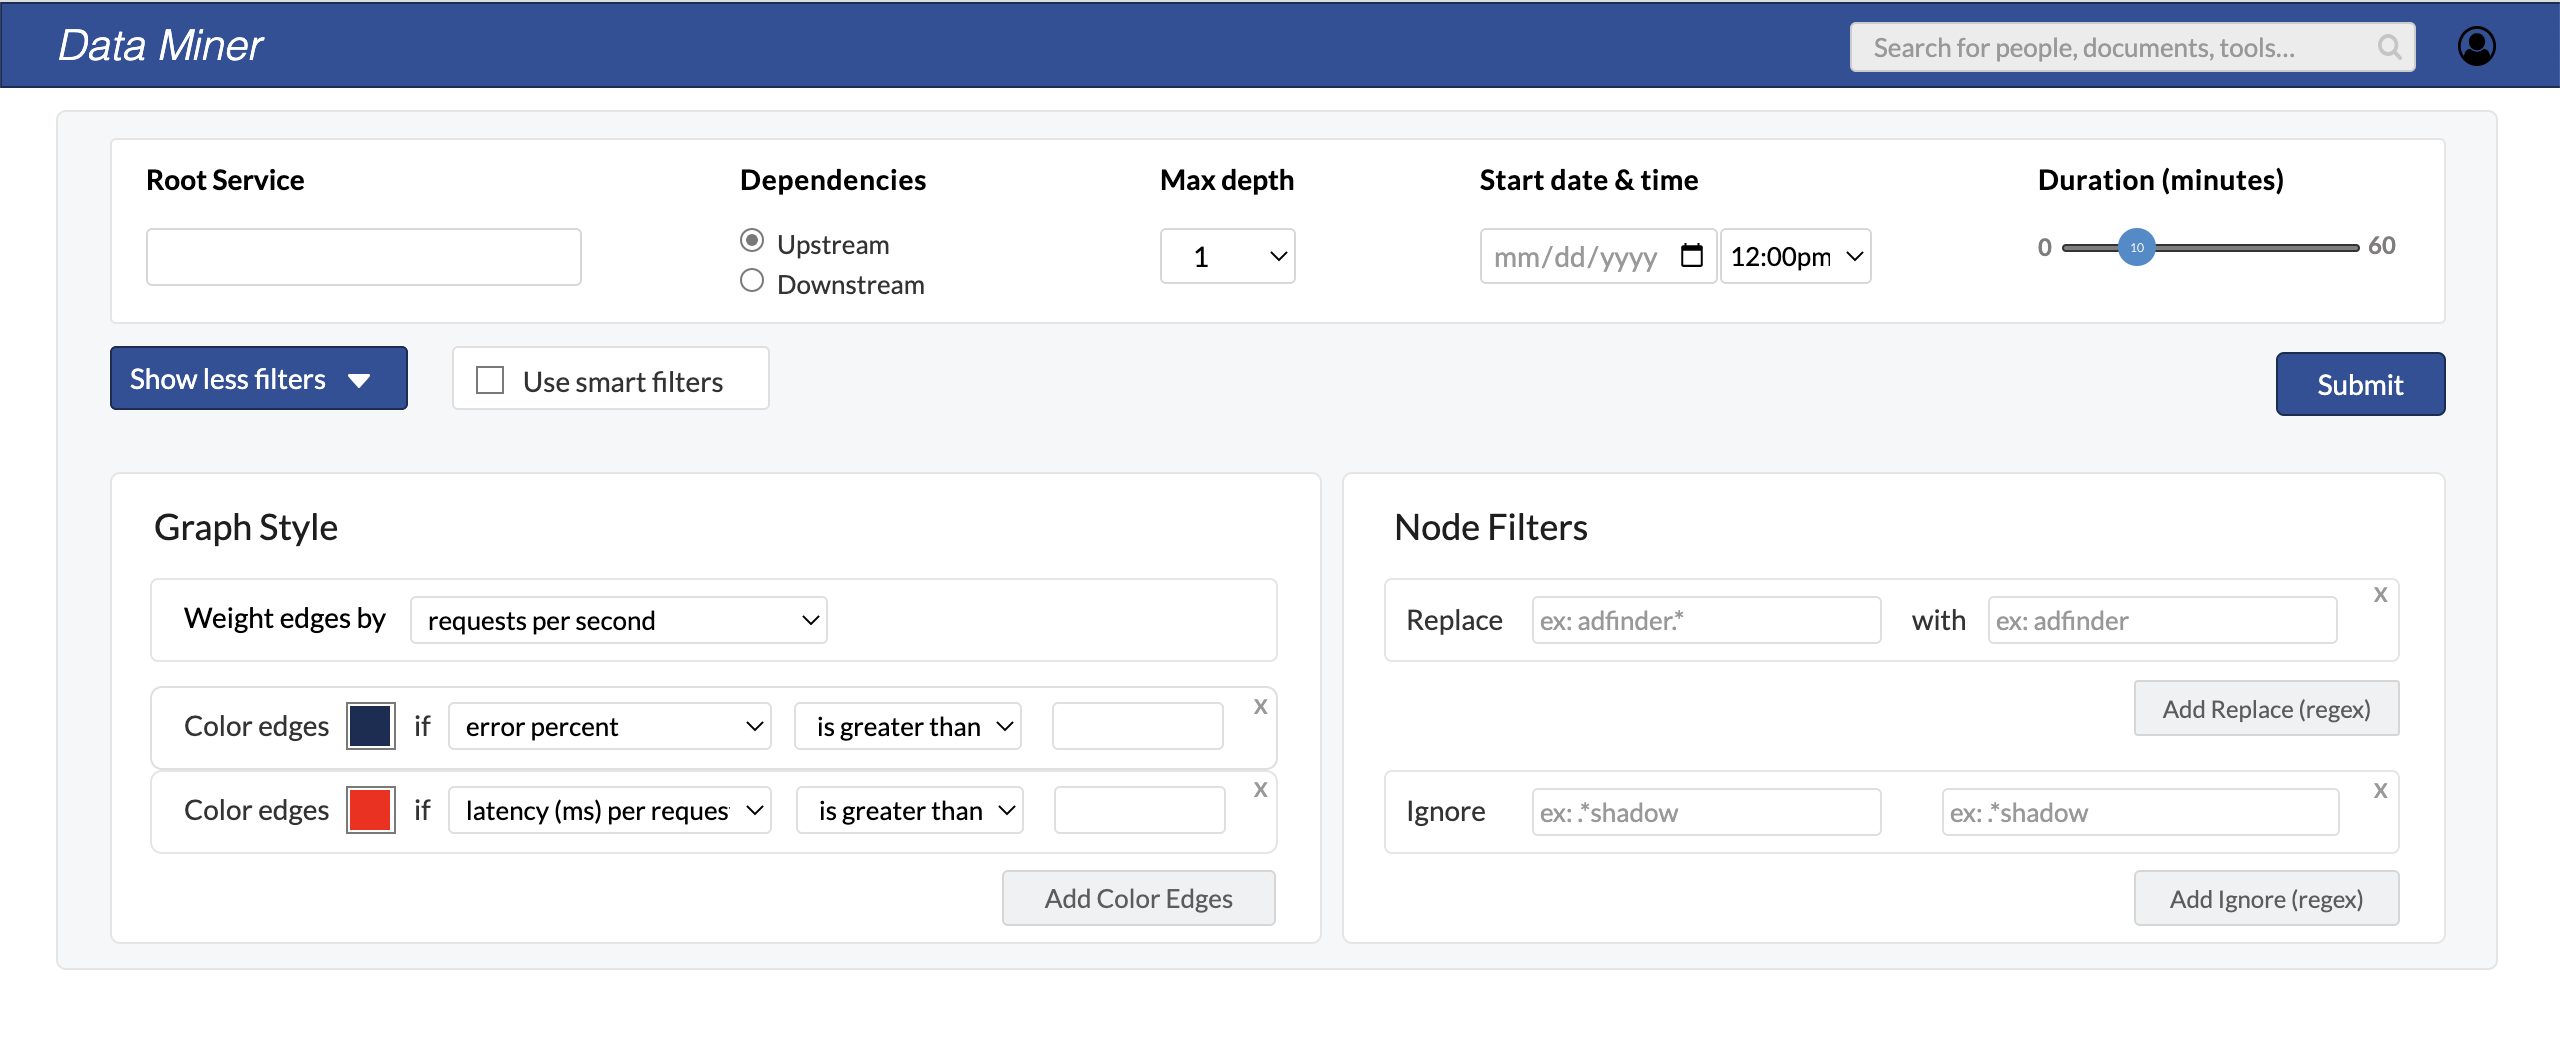
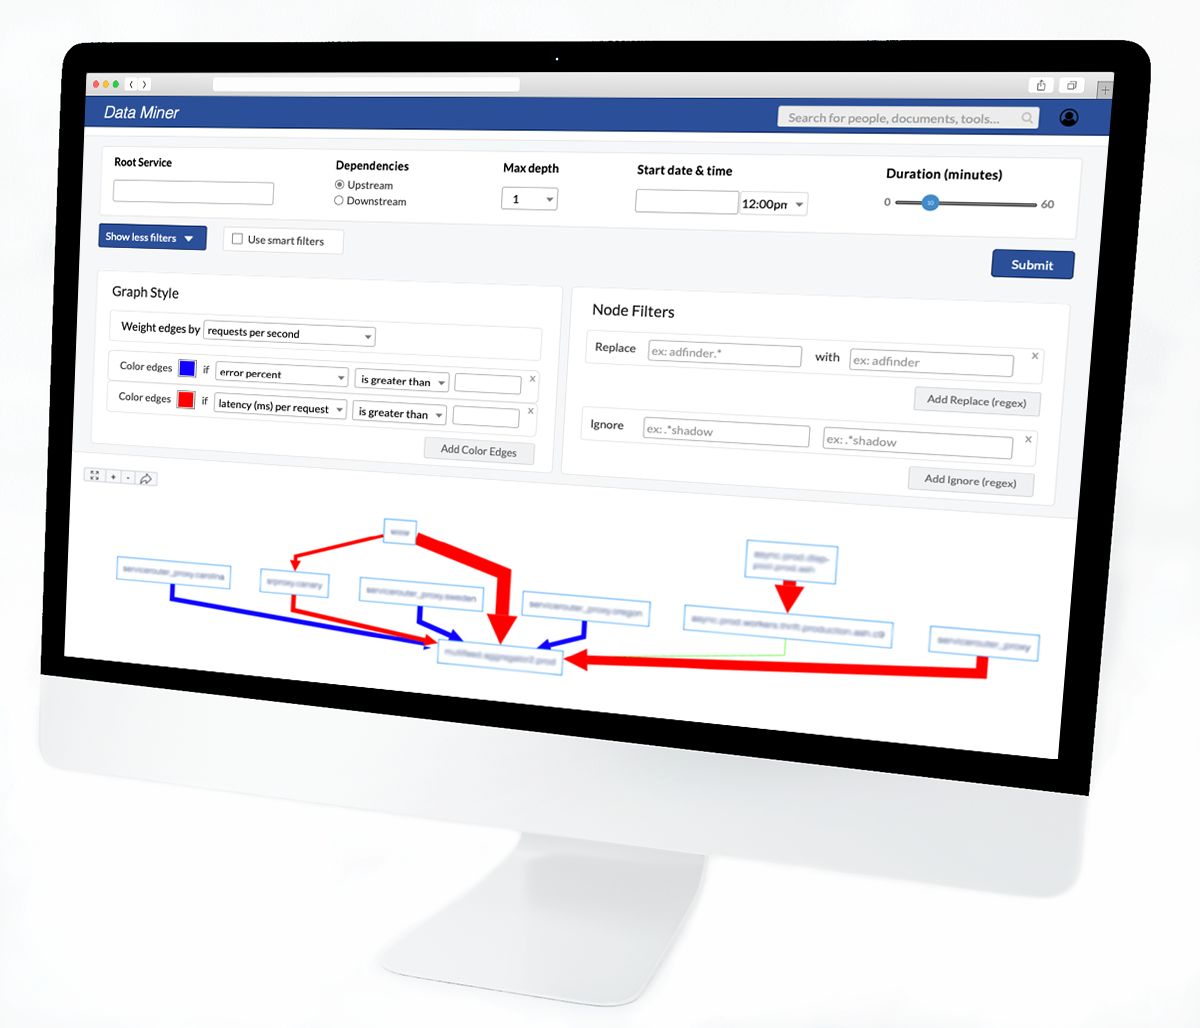
  • Design of the Filters section that narrows down the selection of data so users can zero in on information that provides useful insight into the issue they are debugging
  • Participation in the Front-end development of the User Interface using HTML5, CSS3, Javascript ES6, React.js

Exploration and Requirements:

  • Collaborated with Program Manager and Data Engineers to explore the data to be mined, intended users, scenarios and workflow
  • Create requirements for the search filters section and define UI elements and interactions

Design and Prototyping:

  • Create incremental designs for the ‘Filters’ and ‘Additional Filters’ sections of the User Interface, adding more features and interactions as requested by  Data Engineers
  • Create interactive prototypes and iterate based on feedback

Provide User Interface containing Search Filters section that enables users to:

  • Define basic expressions representing the query parameters or use “Smart Filters” that Data Engineers have predefined to generate data aggregation graphs
  • Style the graph by color-coding edges that identify specific issues such as number of requests per second, latency, and error percent
  • Enter Regex expressions to filter out undesirable data and keep the graph manageable and useful
  • Add and remove elements dynamically

TESTIMONIALS

OTHER PROJECTS